Aptos price analysis reveals that the market is in a bearish trend as prices constantly fall. The APT/USD pair has dropped below the $8.10 mark and is currently trading at around $8.04. This trend is expected to continue in the short term, as there are multiple bearish signals on the daily time frame chart. The selling pressure is expected to remain strong in the coming days, with prices possibly dipping even lower. The support for APT prices is around $7.92, but it is likely that this will be broken if the bearish momentum continues. The next resistance level for the APT/USD pair is around $8.91, which could provide some relief from the current downtrend.
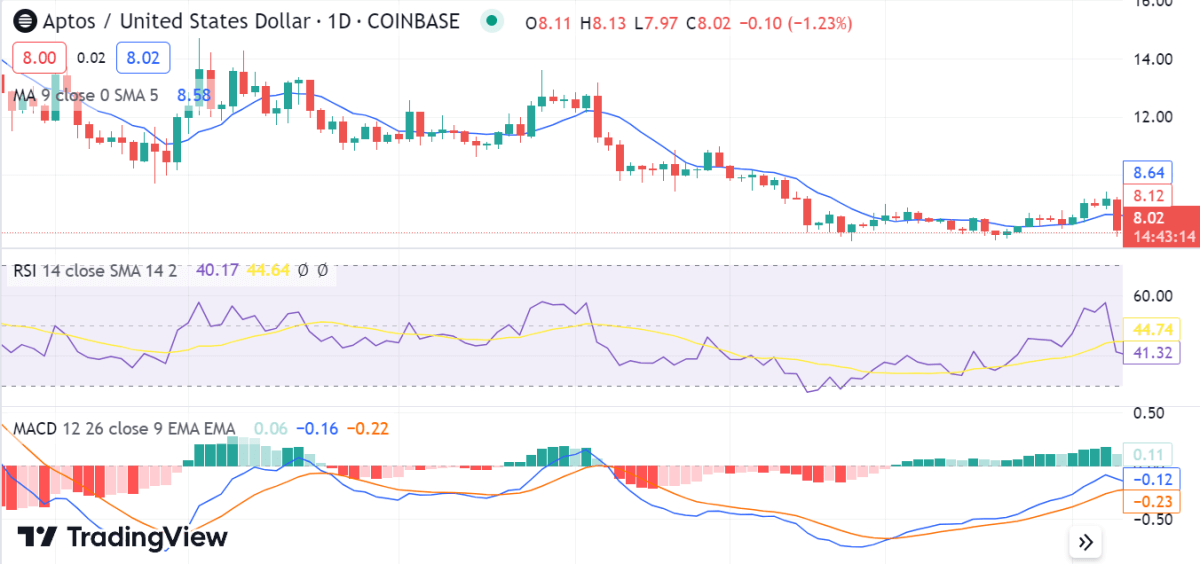
Aptos price analysis 1-day chart: APT price slips below $8.04 as the market becomes negative.
The 1-day Aptos price analysis shows that the market is following a descending channel pattern as prices continuously fall. The market is expected to continue on this bearish path in the near term. However, if the $7.92 support holds, there could be a short-term rebound in prices before it continue to decline. The selling pressure is expected to remain strong in the coming days, with prices possibly dipping even lower.
The moving average convergence divergence (MACD) in the daily chart shows bearish momentum, with the MACD line crossing below the signal line. The RSI is in bear territory and is currently at 41.32, which indicates that the selling pressure is likely to continue in the near term. The 50-day moving average is also trending downward, indicating a bearish trend in the market.
APT/USD 4-hour price chart: Aptos price level drops to $8.04 after a bearish swing
The 4-hour Aptos price analysis shows that the market is currently in a downtrend as prices have been fluctuating around the $7.74 to $9.08 range. The volume has also decreased significantly, which indicates that there is not enough buying pressure to push prices higher. The next resistance level for the APT/USD pair is around $8.91, which could provide some relief from the current downward trend if it is broken.
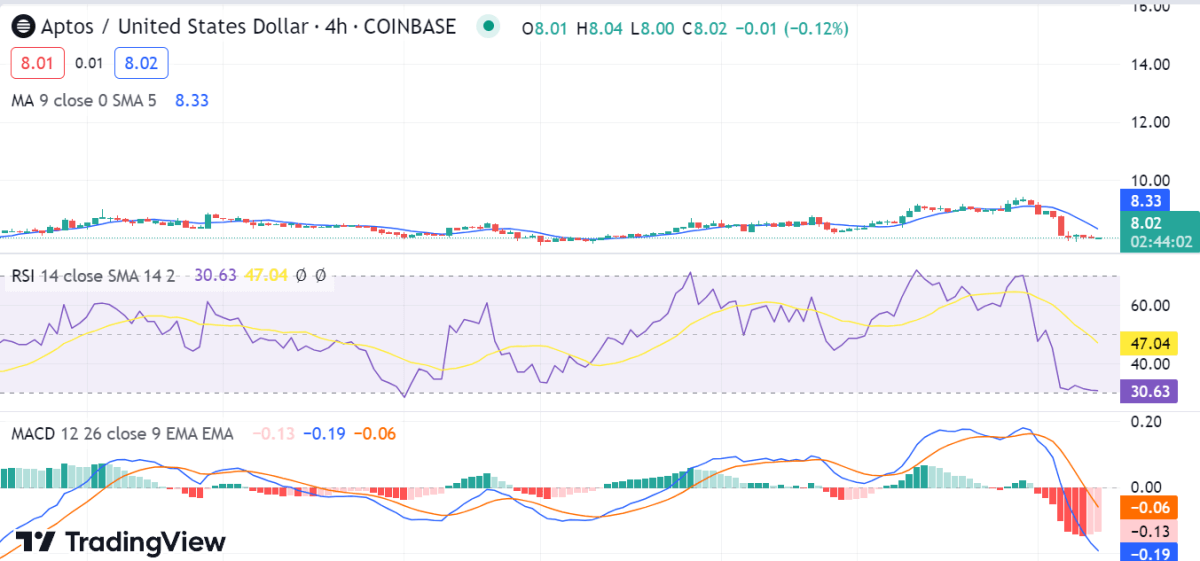
The relative strength index (RSI) is at 30.63, which indicates that selling pressure will remain dominant in the near term. The MACD is bearish and has crossed below the signal line, indicating further downward momentum in prices. The moving average (MA) is also trending downward, which confirms the bearish sentiment in the market.
Aptos price analysis conclusion
To sum up, Aptos price analysis reveals that the market is in a bearish trend as prices constantly fall. The support for Aptos prices is around $7.92, but it is likely that this will be broken if the bearish momentum continues. The next resistance level for the Aptos/USD pair is around $8.91, which could provide some relief from the current downtrend if it is broken. In the near term, the market is expected to continue on this bearish path. However, if the $7.92 support holds, there could be a short-term rebound in prices before it continue to decline.