
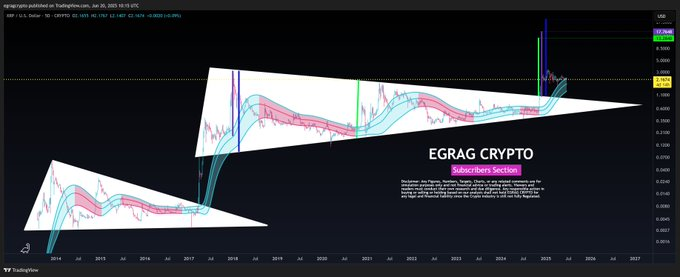
XRP, Ripple’s native token, has once again entered the technical spotlight. After months of constrained price action, the asset appears to have broken out of a symmetrical triangle formation—a classical chart pattern that traders use to signal potential volatility and trend continuation.
The symmetrical triangle, identified by converging trendlines, is often considered a neutral pattern. But when followed by a breakout in either direction, it can imply significant price moves. In XRP’s case, popular analyst Egrag Crypto has noted a breakout to the upside, with volume and momentum indicators aligning.
The technical structure leading up to this breakout had been developing. During that period, XRP traded within a narrowing range—forming lower highs and higher lows—until buyers finally reclaimed control in early June. On-chain data from TradingView indicates that the breakout occurred with daily volume increasing by over 110%, confirming trader participation.
At the time of the breakout, XRP was priced near $0.63. The triangle’s widest range spanned roughly $0.45 to $0.75—a $0.30 spread. Chartists often project potential breakout targets by adding this spread to the breakout point.
However, speculative analysis circulating on social media has gone further, citing Fibonacci extensions and historical fractals that suggest long-term targets as high as $27. These projections, while mathematically derived, lack confirmation from macro fundamentals or regulatory clarity.
This legal clarity, while limited, has improved investor sentiment. But the XRP market remains sensitive to further rulings or U.S. regulatory shifts. That’s an important backdrop when evaluating any breakout, especially one that some traders believe points to a multi-thousand percent move.
Historically, XRP has shown sharp rallies—often linked to news events rather than sustained trend formations. For instance, XRP briefly spiked above $3.80 in early 2018 before experiencing a significant decline. Since then, it has not revisited those highs, and recent rallies have struggled to breach the resistance.
From a purely technical standpoint, XRP’s breakout from a symmetrical triangle aligns with classical chart expectations.
Based on the triangle’s measured move, a short-term target near $3 is justifiable. The $27 projection, by contrast, appears to stem from extended speculative models rather than data-backed analysis.
Still, XRP’s recent breakout, coupled with elevated volume and shifting regulatory sentiment, marks a pivotal moment for the asset. Whether it builds a foundation for sustained upside—or repeats past volatility—will depend on more than geometry.